Whatever its size, to remain competitive and therefore sustainable, an IT services company needs to be efficient.
Steering an digital services company is therefore vital, as it enables us to monitor the achievement of objectives, evaluate performance, diagnose the situation in figures, and support the decisions we need to make.
According to a study carried out by Implid and Entreprise du Futur, 1/3 of companies are focusing on accelerating their digital transformation to boost performance and operational excellence.
Visualizing the results of your Digital Services Company is a decision-making tool to help you grow your business.
In this article, we explain how to manage your IT services company through various performance indicators. We’ll also talk about the tools available to you to support your piloting.
The performance indicators you need to monitor to manage your IT services company
The management of your IT services company requires the assessment of key performance indicators. These will enable you to determine whether the actions you have put in place are conducive to achieving your objectives, or whether you need to readjust your strategy.
KPI’s (Key performance Indicators) also enable you to take a long-term view and anticipate the risks associated with your business.
Sales figures
Sales are a measure of a company’s ability to generate value. When analyzing this performance indicator, we need to distinguish between several elements:
- Invoiced sales, corresponding to all invoices;
- Revenue from services rendered;
- The invoice to be issued corresponds to services performed but not yet invoiced;
- Prepaid income, corresponding to services not performed but invoiced.
Average Daily Cost (ADC)
The average daily cost is also a performance indicator to monitor for an IT services company. This gives you an overview of the company’s profitability. The CJM corresponds to the estimated cost of an employee’s involvement in a project.
There are several ways of calculating it, depending on the employee’s status.
Simple calculations :
| ADC external collaborator = [(ADR excluding taxes X number of annual working days) + (monthly charges X12)] / Number of annual working days) |
| ADC internal employee = (gross annual salary / number of potential working days per year) X load factor) |
Average Daily Rate (ADR)
The Average Daily Rate is the average amount billed to Digital Services Company customers for one day. The rate must cover the ADC to avoid losses.
| ADR = sales generated over the selected period / number of days generated over the period |
Activity rate excluding vacations (AREV)
Also known as the staffing rate, the activity rate, excluding vacations , gives an insight into an IT services company’s operational performance.
| AREV = (Number of days produced) / (Number of potential days – vacations |
Activity rate including vacations (ARIV)
The same as ARIV, except that vacations are included.
| ARIV = Number of days produced / (Number of potential days) |
The workforce
The company’s employees also have an influence on the profitability of the Digital Services Enterprise, sincethey have a non-negligible cost.
Several indicators can be used to assess workforce-related performance:
- Turnover;
- Average seniority.
The margin
Margin is also a good indicator of the performance, since it allows us to analyze the money earned by the company through its services.
| Gross margin = ADR – gross salary |
Outstanding receivables
Outstanding receivables provide an overview of the average number of days your invoices are overdue and the total number of outstanding receivables. Outstanding accounts receivable can have a negative impact on company’s growth, as it worsens the cash position.
| Trade accounts receivable = Trade accounts receivable + Discounted bills of exchange – Advances and deposits received on orders in progress |
The essential tool for managing your IT services company
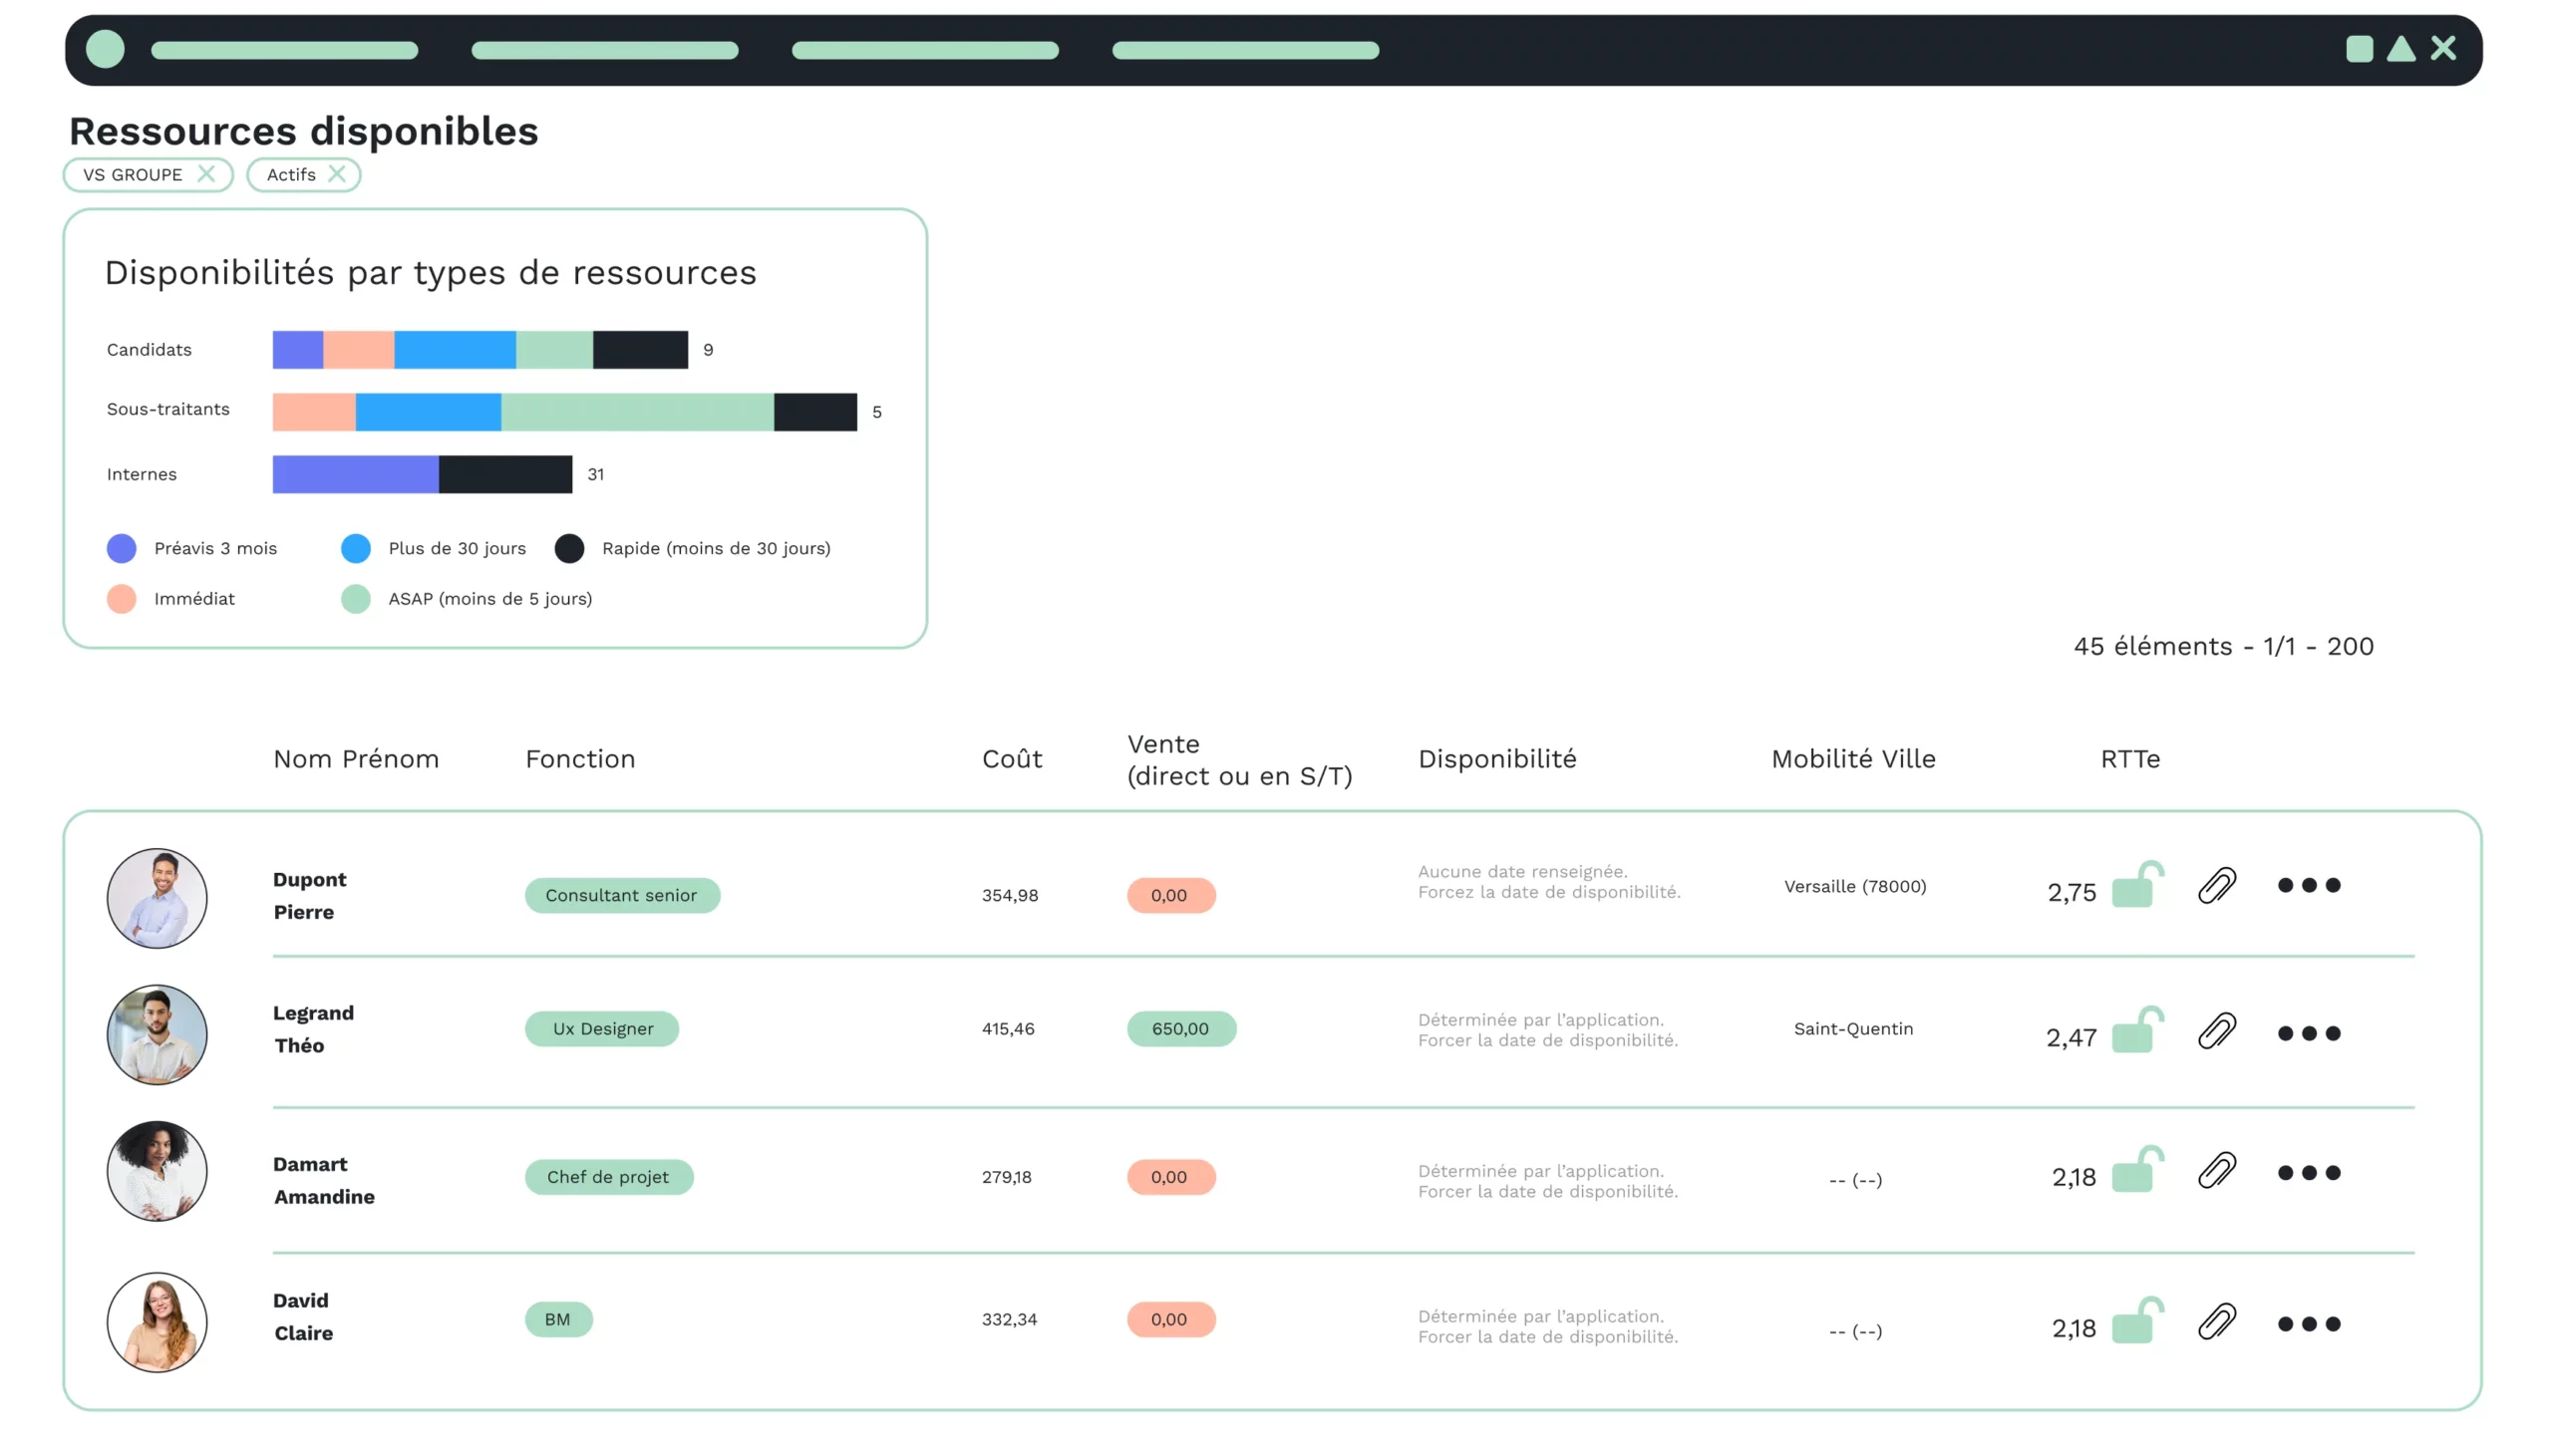
It’s one thing to know the performance indicators you need to manage your IT services company, but it’s equally important to create dashboards to monitor these different indicators. On the other hand, making decisions based on reliable data is a very important point, indeed the most important.
Yes, dashboards and charts are great tools for tracking the performance of your digital services business. You have a clear idea of where improvements are needed.
However, if you use Excel-type spreadsheets or several independent management tools, a number of problems may arise:
- The data are scattered;
- Data differ from one software package to another, or from one file to another, making it difficult to exploit the data and thus analyze ESN performance.
This is why, when you use an ERP-type management tool, you have :
- on the one hand, several UN software packages (CRM, HRIS, accounting, etc.), enabling data to be centralized;
- secondly, the data is updated automatically and every time an employee performs an action, ensuring that the information is up to date and reliable.
What’s more, the ERP solution’s Business Intelligence technology correlates the various integrated data and generates reports to automatically measure performance .